
12 August 2013 11:02 AM
GMT
By: DailyForex.com
It has been two and a half weeks since I made my last day-to-day analysis of this pair. My forecast then for the next few days was:
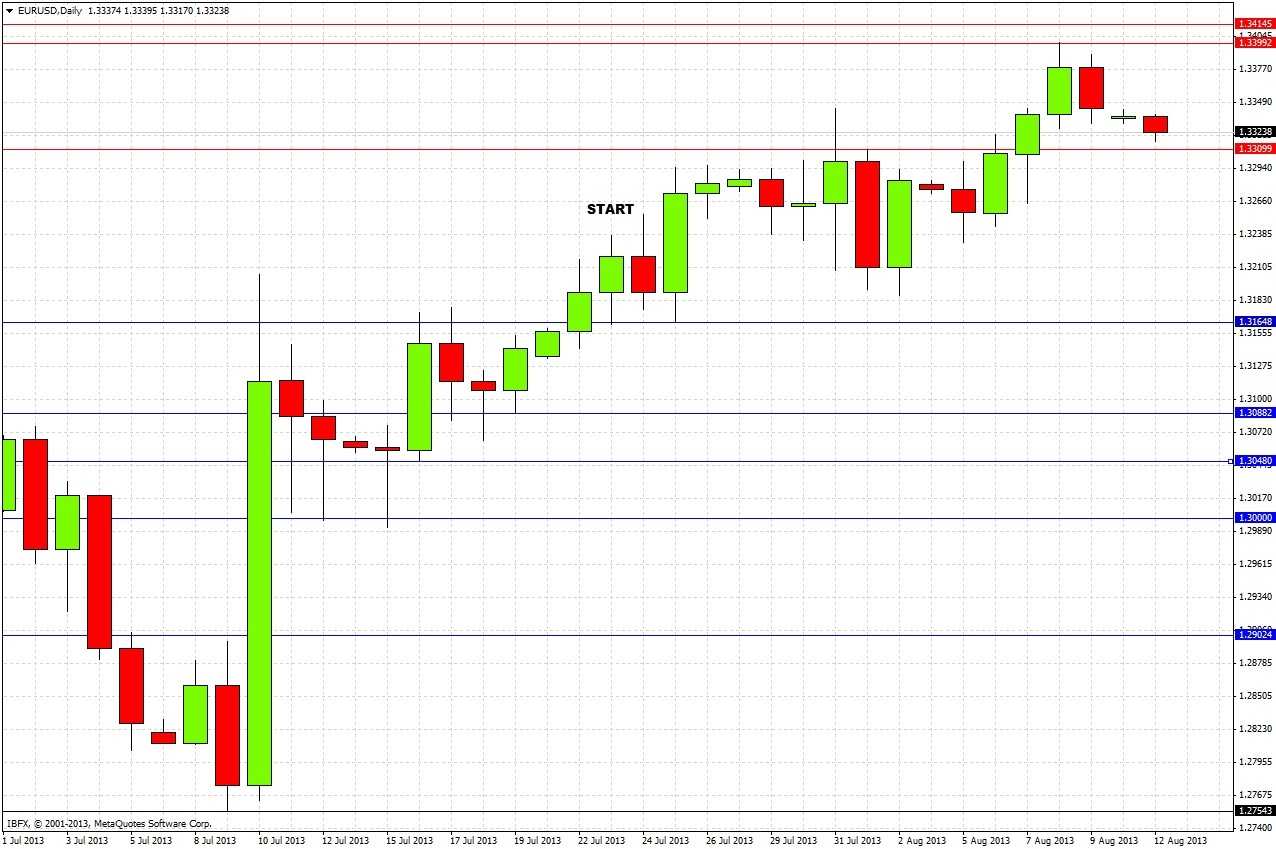
Clearly the bias is bullish, but we are approaching what is likely to be fairly serious resistance overhead at around 1.3250, which is also a number of minor psychological importance.
As there is quite strong bullish momentum, I would be nervous to take any shorts off of the zone around 1.3250 unless the bullish trend really slows down first for a few days and we get some consolidation instead. Grabbing a few pips off a fast spike up there could be OK, but I would not take any swing trades short today or tomorrow.
If the price should break through 1.3260, it is likely that it will not go very far to the upside. 1.33 should also act as resistance, but if that is broken decisively then 1.34 is achievable.
This is a perfect summary of how the pair has progressed since then, reversing short off 1.3250 later that same day before coming back bullish to be held by resistance at 1.33, before breaking 1.33 decisively before being held by 1.34. It has taken two and a half weeks just for the price to move by even these small amounts and the action is now quite quiet.
Looking to the future, the picture is more complicated than it first seems. Viewing the weekly chart shows a bullish picture: the week that just closed is a bullish reversal, closing right on the high of its previous week, pointing to continuing bullishness and a rise to at least its high at 1.3399:

However, there are two things that should make us cautious: firstly, the major swing high just beyond last week's high, at 1.3415, which was also the high of the last bearish reversal week. Secondly, and more importantly, there is a major multi-year trend line which has not been broken to the upside. This combination means there is major resistance overhead, as we can see from the monthly chart:

Turning to the daily chart, we had a bullish reversal a few days ago, which broke the high of the bearish reversal from a few days before that. The candles show continued bullish impetus, but we only managed one day's close above the 2 year trend line, before Friday closed the week just below it:
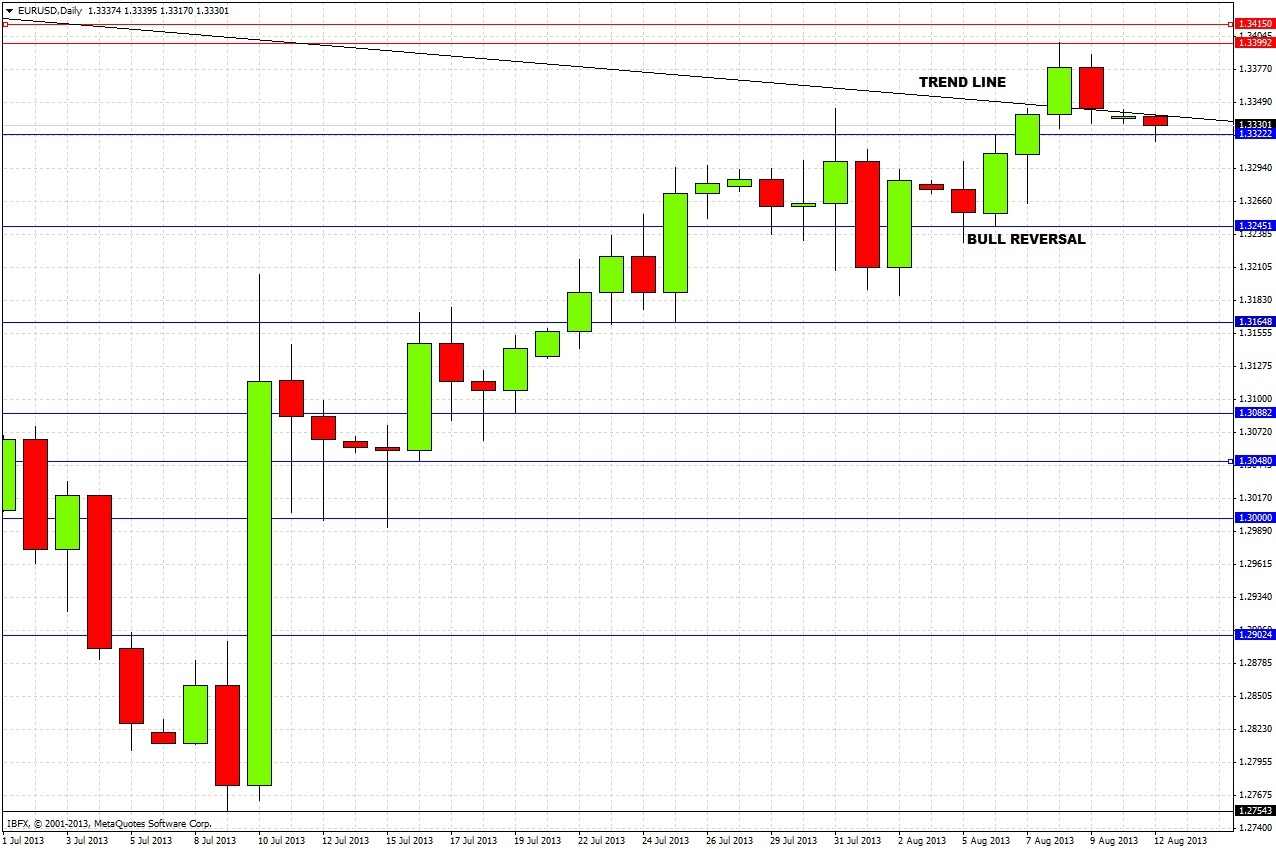
This pair is in the balance, and what happens next should provide a good clue as to whether we are going up to 1.37 or down back to 1.31 and below. If we get a daily close above the trend line we are going back up to at least 1.34. If we get a daily close above 1.34, we are going up to around 1.37.
On the other hand, a daily close below 1.3322 is a bearish sign, and a daily close below 1.3245 will signify a move down to 1.3165 at least.
The highest probability trade to watch out for intraday would be a short trade following a strong bearish reversal off the 1.3400-1.3415 level.
By: DailyForex.com
It has been two and a half weeks since I made my last day-to-day analysis of this pair. My forecast then for the next few days was:
Clearly the bias is bullish, but we are approaching what is likely to be fairly serious resistance overhead at around 1.3250, which is also a number of minor psychological importance.
As there is quite strong bullish momentum, I would be nervous to take any shorts off of the zone around 1.3250 unless the bullish trend really slows down first for a few days and we get some consolidation instead. Grabbing a few pips off a fast spike up there could be OK, but I would not take any swing trades short today or tomorrow.
If the price should break through 1.3260, it is likely that it will not go very far to the upside. 1.33 should also act as resistance, but if that is broken decisively then 1.34 is achievable.
This is a perfect summary of how the pair has progressed since then, reversing short off 1.3250 later that same day before coming back bullish to be held by resistance at 1.33, before breaking 1.33 decisively before being held by 1.34. It has taken two and a half weeks just for the price to move by even these small amounts and the action is now quite quiet.
Looking to the future, the picture is more complicated than it first seems. Viewing the weekly chart shows a bullish picture: the week that just closed is a bullish reversal, closing right on the high of its previous week, pointing to continuing bullishness and a rise to at least its high at 1.3399:
However, there are two things that should make us cautious: firstly, the major swing high just beyond last week's high, at 1.3415, which was also the high of the last bearish reversal week. Secondly, and more importantly, there is a major multi-year trend line which has not been broken to the upside. This combination means there is major resistance overhead, as we can see from the monthly chart:
Turning to the daily chart, we had a bullish reversal a few days ago, which broke the high of the bearish reversal from a few days before that. The candles show continued bullish impetus, but we only managed one day's close above the 2 year trend line, before Friday closed the week just below it:
This pair is in the balance, and what happens next should provide a good clue as to whether we are going up to 1.37 or down back to 1.31 and below. If we get a daily close above the trend line we are going back up to at least 1.34. If we get a daily close above 1.34, we are going up to around 1.37.
On the other hand, a daily close below 1.3322 is a bearish sign, and a daily close below 1.3245 will signify a move down to 1.3165 at least.
The highest probability trade to watch out for intraday would be a short trade following a strong bearish reversal off the 1.3400-1.3415 level.
No comments:
Post a Comment